This website contains output of habitat suitability models for a selection of NSW threatened species, including maps of current and future habitat suitability for individual species, and maps of multi-species refugia from climate change.
Click on the link from the main page. In the new window, click in the search box at the top of the page, and start typing in a species name (scientific or common):
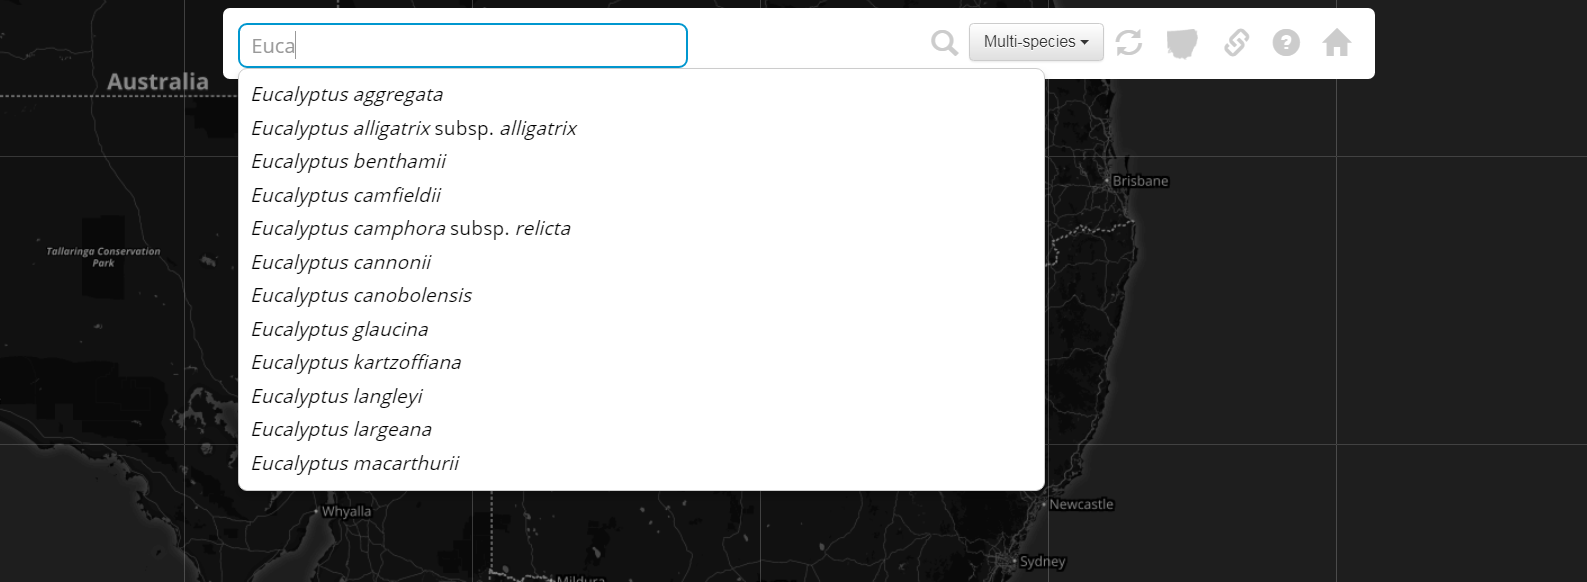
A list of the top matching species will appear. Select a species from the list, or press Enter to display a list of all matches.
If you have already viewed maps for one species and wish to view maps for a second species, click on the magnifying glass icon on the right of the search bar to reset it.
When the map for the species is displayed, the legend appears to the bottom left of the screen, indicating how suitable the habitat is, the climate scenario and time period and whether thresholding has been enabled.
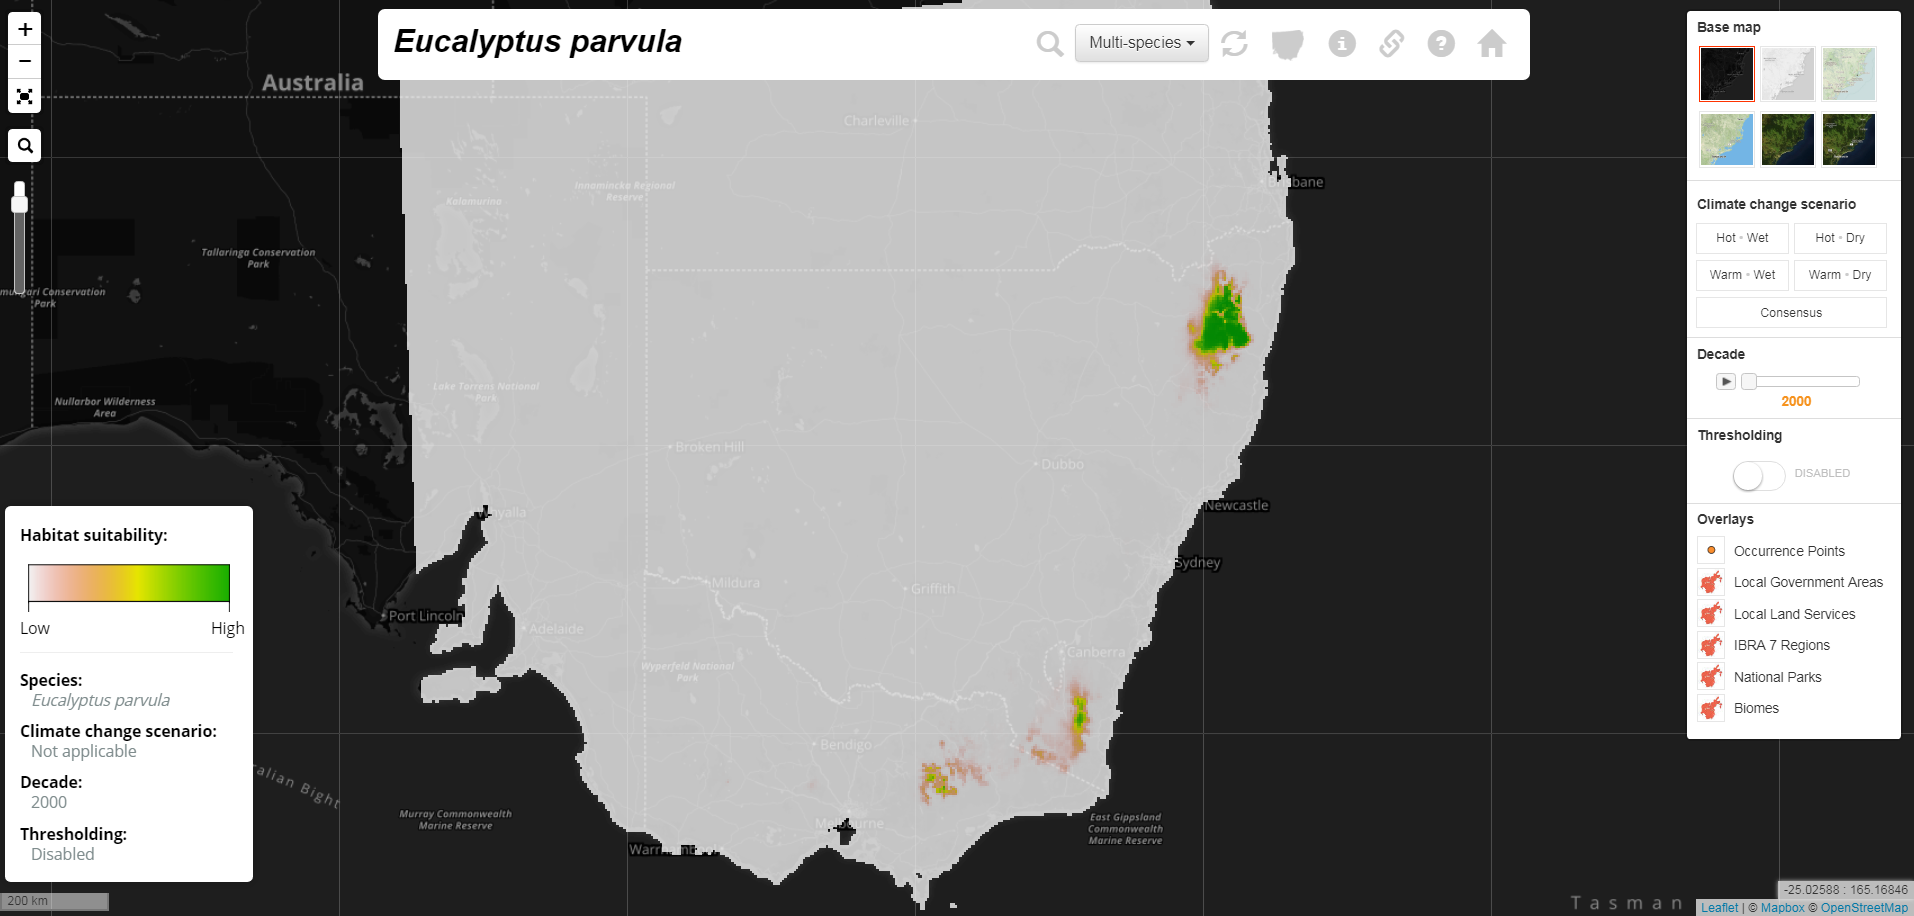
These elements can be controlled using the layers panel (revealed by clicking on the layers icon at the top right of the screen). From this panel, different base maps can be selected on top of which habitat suitability will be displayed.
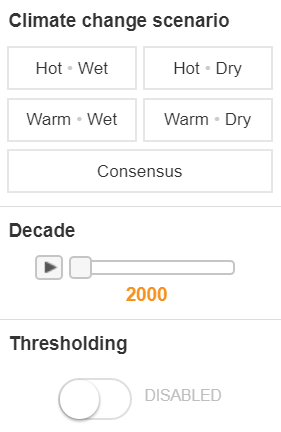
To view projected changes in habitat suitability associated with the four climate scenarios, select one of Hot/Wet, Hot/Dry, Warm/Wet, Warm/Dry. Hovering over these will display a tool-tip with a brief description of the scenario. There is also a Consensus button. This displays a map with values ranging from 0 to 4, where 0 refers to grid cells unsuitable in any future climate scenario, 1 means suitable under only one of the scenarios ... while 4 means suitable under all of the scenarios for that time period. To adjust the time period, either manually move the slider across the bar or press the play button to watch the transition in suitability over time. The final option in this part of the layers panel is enabling/disabling the Thresholding button. Thresholded maps are those where habitat suitability is presented as suitable (1) or unsuitable (0). Unthresholded maps have suitability presented as continuous data (i.e. 0 to 1).
Below the Thresholding option are a series of overlays that can be selected to render on top of the habitat suitability map. These include occurrence records (note that there may be additional occurrence records that we did not include because they did not meet our data cleaning criteria), Local Government Areas (LGA), Local Land Services regions (LLS), and National Parks (NP). Note that LGA, LLS and NP cannot be displayed simultaneously. Also included is a layer identifying grid cells with high vegetation condition. Since our models do NOT include vegetation or land-use types, it may be instructive to look at the relationship between cells that have both high suitability for a species and high vegetation condition.
To identify populations that may be at more or less risk from climate change, ensure that the occurrence records are visible, zoom in to an area with occurrence records, select a climate scenario and play through the animated time periods to see how suitability is projected to change between now and 2070. Suitable regions that currently contain populations, and are projected to remain suitable in the future, can be classified as internal refugia. Conversely, regions from which populations are currently absent but that become or remain suitable in the future can be classified as external refugia. Populations likely to be least at risk from climate change can be identified by selecting the Consensus option - for these populations, climate (by that time period) is likely to be suitable irrespective of the future scenario.
All data presented on this website can be downloaded for further analysis. This can be particularly useful for refining projections of habitat suitability, such as by overlaying them with vegetation type within a geographic information system. To download a compressed file containing all of the maps for a single species, display that species on screen and click the download icon on the search bar. Be warned - the resulting zip file contains 65 maps and range in size from ~10-200MB. These consist of maps of continuous and binary suitability, for each decade and climate scenario, as well as the consensus.
When displaying either the LGA or LLS layer, users can click on a region and download a report summarising the projected changes to the size of suitable habitat for species present in that region.
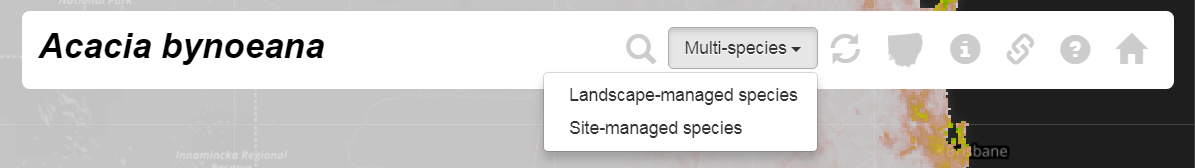
On the home page, click the multi-species drop-down to view regions likely to be refugia for multiple species. Select either landscape-managed or site-managed species. Again, using the options on the right side of the screen, select a climate scenario (or Consensus) and play the animation to view a map indicating the number of species a grid cell is likely to remain an internal refugium for. For more detail on how we calculated multi-species refugia, see our OEH Report.